
Highpointe is following typical seasonal trends, so far…
The first half of 2026 delivered a dramatic shift in the Highpointe real estate market. After a frozen winter where listings sat idle, spring ushered in a massive surge in inventory—and buyers snapped up properties at record speeds, bringing pricing into a healthy, predictable groove.
Key Highlights at a Glance
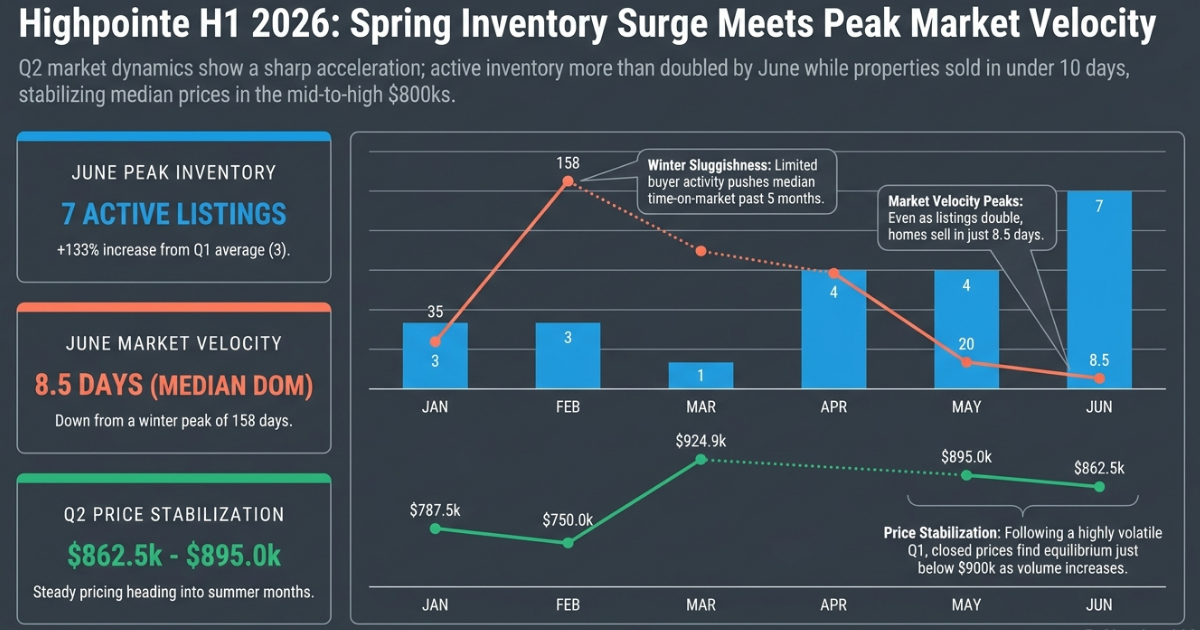
Inventory Peak: 7 Active Listings in June — up +133% compared to the Q1 average of 3 listings.
Speed to Contract: 8.5 Days (Median Days on Market in June) — a breathtaking acceleration from February’s peak of 158 days.
Price Range Equilibrium: $862.5k – $895.0k — price levels stabilized heading into summer after a wild Q1 ride.
Let’s talk about what this data means for you and your plans! 512-749-2280
Month-by-Month Market Breakdown
1. Winter Sluggishness (Jan – Feb)
Active Listings: 3 in Jan | 3 in Feb
Median Days on Market: 35 days (Jan) $\rightarrow$ 158 days (Feb peak)
Closed Price: $787.5k (Jan) $\rightarrow$ $750.0k (Feb)
The Story: Limited buyer activity pushed time-on-market past 5 months during the February trough. Prices hit their lowest point before reversing course.
2. The Early Spring Pivot (Mar – Apr)
Active Listings: 1 in Mar | 4 in Apr
Closed Price Peak: $924.9k in March
The Story: Inventory contracted sharply in March down to a single active listing, sparking a temporary price spike near $925k. By April, listings quadrupled back to 4 as sellers began listing for the spring.
3. Peak Velocity & Stabilization (May – Jun)
Active Listings: 4 in May | 7 in June
Median Days on Market: 20 days (May) $\rightarrow$ 8.5 days (June)
Closed Prices: $895.0k (May) $\rightarrow$ $862.5k (June)
The Story: Even as inventory doubled in May and peaked in June, market velocity surged. Buyers absorbed the new supply almost instantly, dropping median time-on-market under 9 days. Following a volatile Q1, closed prices settled neatly just under $900k heading into mid-summer.