
What is “Sale-To-List Price Ratio” Really Telling You?
There are endless data points in real estate, and while some are more useful than others, one principle always holds true: a number without context can be misleading.
The sale-to-list price ratio is a perfect example. On the surface, it looks simple. Homes sold for 98 percent, 100 percent, or even 103 percent of list price. But what does that actually mean for your home, your neighborhood, and your timing for selling or buying or both?
To understand what this metric is really telling you, you need to understand the context behind the data:
What specific geographic area does the data represent? Citywide, zip code, school district, or a single subdivision?
What time frame was used? Last 30 days, 6 months, or 12 months?
What criteria were used for the homes included? single family only?
Where is the data coming from? Is it coming from aggregation sites like Zillow or Homes.com or directly from the MLS? Is new construction aka builder data included?
Is the data showing a median or an average? (do you know the difference between the two?)
If you are not sure where to find reliable, neighborhood-level numbers, start with my Local Market Data hub, where I break down trends by community rather than relying on broad zip-code averages.
Okay, but which “list price”?
What the sale-to-list price ratio is telling you in simple, everyday terms.
A list price ratio of 100% means that the home sold for 100% of the CURRENT list price, not the original.
Let’s say the ratio is 98%, that means that the home sold for 98% of its list price.
And as you likely could guess, if the list price ratio is over 100%, that means that the buyer paid more than the list price. 105% sale-to-list price ratio would equate to the buyer paying 5% more than the current list price.
A Tale of 2 Sellers
There was once a seller, Sam, hired an agent will little experience with market data. Sam asked his agent (who was not me) what the sale-to-list price ratio.
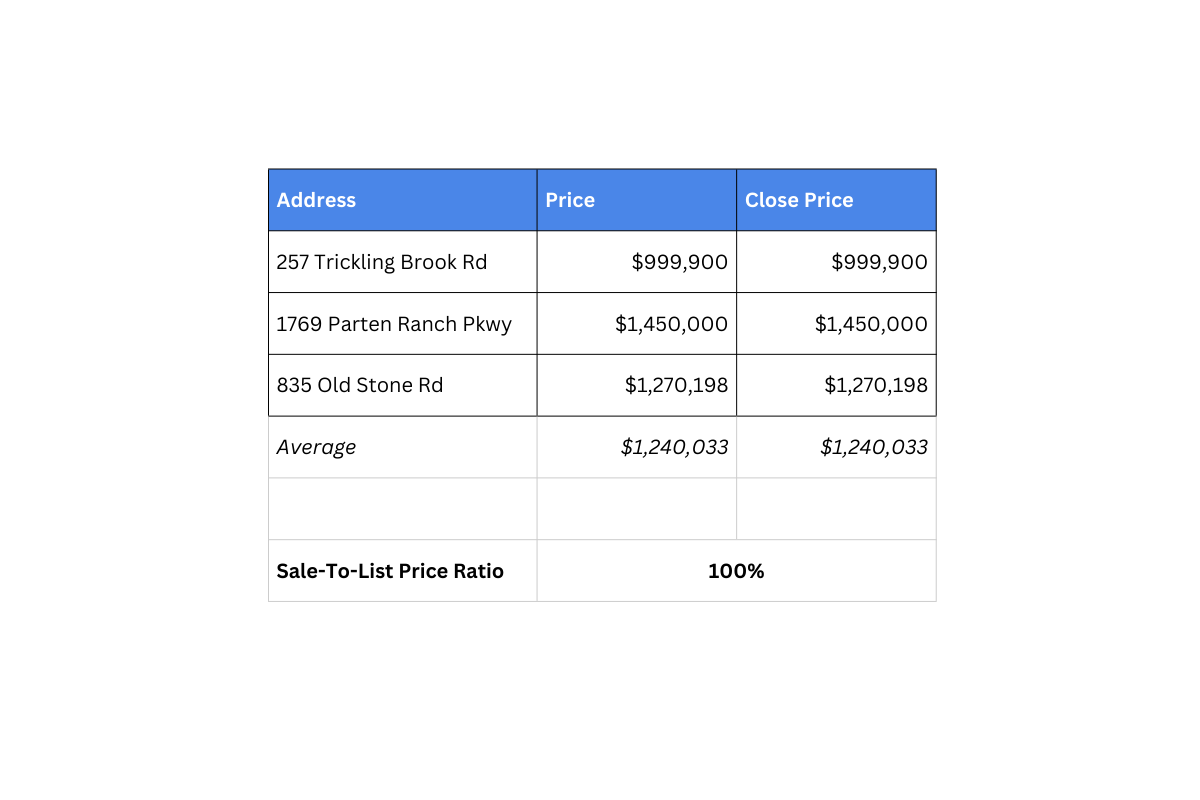
This is the report Sam’s agent uses to answer his question.
“Great!” he says “Sellers are getting their full ask price, I should absolutely list at the high end of our range!”
The second seller, Sidney, interviewed to find the best agent for her, and that was me! Sidney asks the same questions as Sam, what’s the Sale-To-List Price Ratio.
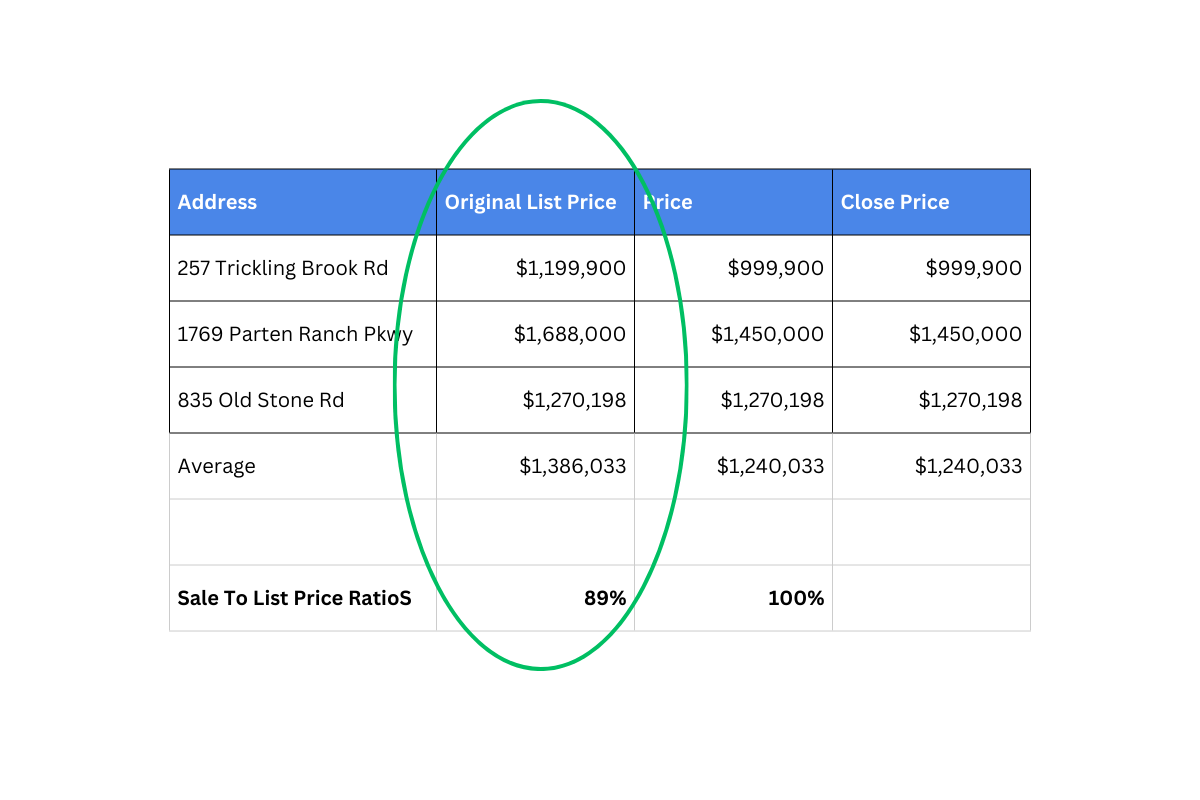
Here is the report I used to get Sidney that information.
As a result Sidney knew that pricing her home at the high end of her range would likely lead to longer days on market AND a much lower sales price.
Whether you are buying or selling or just exploring your options. Be sure to know the context of the data you’re using to make your decisions.
I wholeheartedly believe that it’s never too early in your real estate journey for a conversation, let’s talk!