
February 2026 Real Estate Data Is In! Compare month-over-month stats for your target neighborhood.
“All neighborhoods in DSISD are the same” - WRONG. WRONG. WRONG. All neighborhoods are not created equally and the real estate market reflects it. Below is summary of a few of the neighborhoods that I track closely. Don’t see the neighborhood where you live or hope to? No worries, send me a message and I’ll send the information over to you.
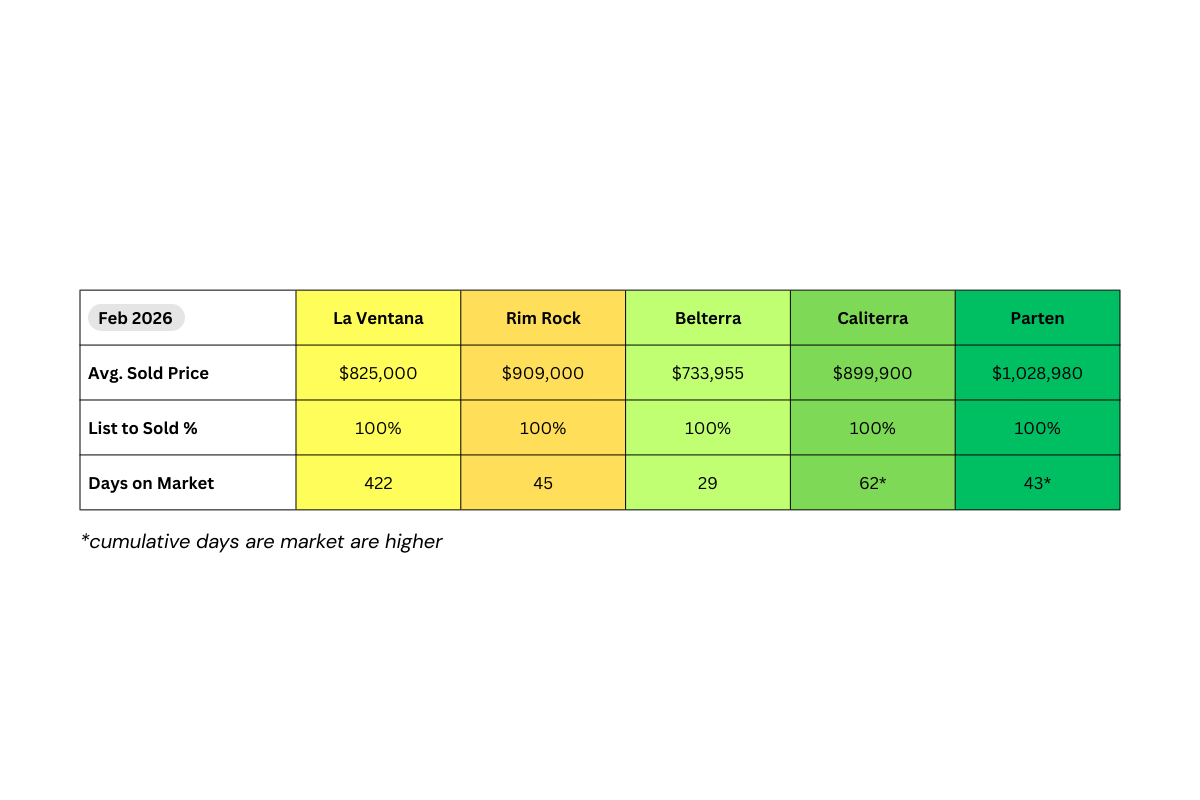
Neighborhood Spotlights: A 3-Month Trend Analysis
La Ventana: Stability in Luxury
In La Ventana, the average sold price has seen a significant adjustment, moving from $1,100,000 in December 2025 down to $825,000 in February 2026. While prices have leveled, demand remains precise; homes are still closing at 100% of their list price, though they are staying on the market longer, averaging 422 days in February.
Rim Rock: Consistent Demand
Rim Rock continues to demonstrate resilience. Average sold prices moved from $945,000 in December to $909,000 in February. The most striking trend here is the speed of sales: average days on market dropped sharply from 106 days in December to just 45 days in February, all while maintaining a 100% list-to-sold price ratio.
Belterra & Caliterra: The Current Leaders in Value
These neighborhoods are seeing a healthy injection of new inventory:
Belterra: Saw 4 new listings and 4 closed sales in February, with an average sold price of $733,955. Homes here are moving fast, averaging only 29 days on market.
Caliterra: Average sold prices rose from $808,465 in December to $899,900 in February. This market is highly competitive, with a 100% list-to-sold price ratio and inventory tightening to 17 active listings.
Parten: Premium Growth
Parten has shown strong price growth over the last quarter, with average sold prices climbing from $956,576 in December to $1,028,980 in February. While cumulative days on market can reach 91, the most recent February closings averaged just 43 days, indicating that well-priced homes are moving quickly.
Founders Ridge & Reunion Ranch: Exclusive Opportunities
Inventory remains tight in these enclaves:
Founders Ridge: Reported 0 active listings in February (excluding flex listings), with the lone February sale closing at $505,000 in 44 days.
Reunion Ranch: Currently holds only 1 active listing, showing the extreme scarcity of available homes in this specific pocket.
List to Sold % can be very misleading, review this quick post to make sure you understand what this number is, and isn’t, telling you.
What Does It All Mean?
We are seeing a move toward a more balanced, yet efficient market as the volume of homes coming on the market in both Driftwood and Dripping Springs neighborhoods. While the frantic over-asking environment of previous years seems to have vanished, the 100% list-to-sold price ratio across nearly every neighborhood proves that sellers who price accurately are being rewarded with full-price offers. If you’re a seller who wants to attract multiple offers, talk to your agent about pricing your property between 3% - 5% below market value. This works well under most market conditions.
For buyers, the slight increase in days on market in some areas provides a breathing room, but again, homes that are priced well are selling quickly and from time to time with multiple offers. However, in high-demand pockets like Belterra, the window to act remains narrow.
Are you curious how these shifts affect your home's value? Whether you are in Caliterra or Rim Rock or anywhere in between, hyper-local data is the key to making a smart move. It’s never too early in your real estate journey for a conversation. Let’s Chat!